Comparative Balance Sheet Template
A Comparative Balance Sheet is a financial statement that presents a company's assets, liabilities, and equity for two or more periods side by side. This format allows stakeholders to easily analyze changes in the company's financial position over time, identify trends, and assess financial performance through variance analysis.
See the comparative balance sheet template in action.
Unlike a standard balance sheet that shows data for a single period, a comparative balance sheet displays multiple periods (typically two consecutive fiscal years) in adjacent columns, along with variance calculations showing both absolute and percentage changes.
Utilizing the Comparative Balance Sheet Template
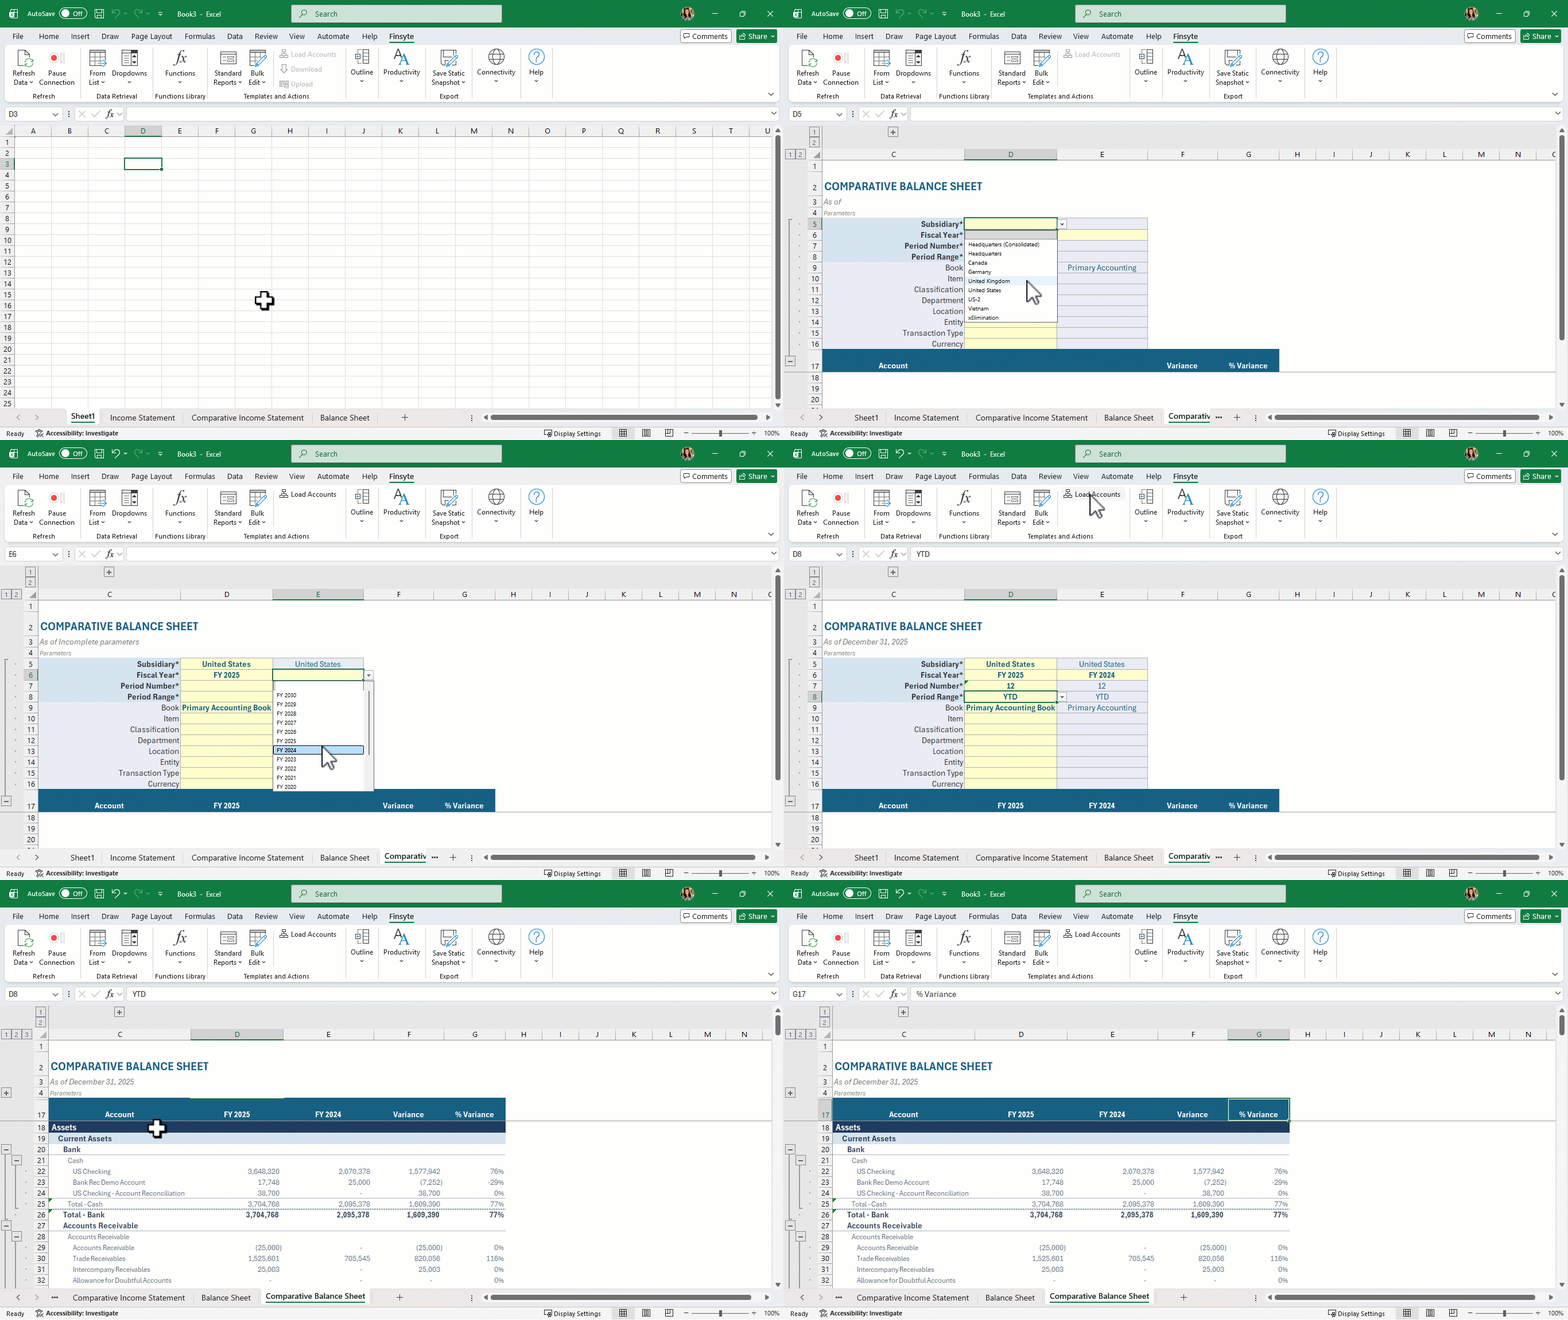
- Select Standard Reports > Balance Sheet > Comparative Balance Sheet
- View the new sheet that has been created called Comparative Balance Sheet
- Fill in all required parameters (asterisks by the names)
- Select the now activated button in the ribbon under Actions of Load Accounts. Finsyte will go to NetSuite to return the appropriate list of GL Account numbers and balances based on the identified Subsidiary input.
- Adjust parameters as needed. The balances update on their own.
- The Switch Signs operation has already been applied to corresponding account sections.
Remarks
- Choose a Fiscal Year for both column D and column E; column E's Fiscal Year starts blank. Column E's other parameters follow column D until you change them, so you can also compare a different subsidiary, period number or other parameter. Variance is column D minus column E, and % Variance is that variance divided by column E (0% when column E is 0).
- Review the GL Accounts list to understand what accounts will be available for the balance sheet. Every account that falls under the system generated account of FSN_L0_BAL will be returned. The Parent column in this table also helps to determine the tree structure seen in the template.
- Review the Subsidiary column in the GL Accounts list to understand which accounts utilize which subsidiaries. The SubsidiariesHasAccess column generated by Finsyte can also be insightful for this.
- For a consolidated report, or to compare subsidiaries, select the top-level (Consolidated) subsidiary in column D before you select Load Accounts so the sheet brings in every account. An account a subsidiary can't use returns 0 and can be ignored.
- Once you've customized the template, don't select Load Accounts again. It rebuilds the account list in the template's own columns only, which undoes your layout.
- Aggregate functions are utilized on the totals for groups in the financial statement to ensure proper totaling.
- The accounts under Liabilities & Equity have reversed signs for totaling purposes.