NetSuite Income Statement Template for Excel
An income statement in Excel that fills itself from your NetSuite general ledger and stays current, so this month’s P&L is one refresh away.
Silent screen recording in Excel. On the Finsyte ribbon, Standard Reports › Income Statement › Income Statement adds an Income Statement sheet with a parameter block at the top. Subsidiary is set to United States, Fiscal Year to FY 2025, Period Number to 12, and Period Range to YTD, with Book on Primary Accounting Book. The title line updates to As of December 31, 2025. Load Accounts on the ribbon collapses the parameters and fills the United States column with the account tree under Ordinary Income/Expense: Income, where Sales, Revenue and Shipping Income roll up to Total - Income of 4,970,512, followed by Cost of Sales.
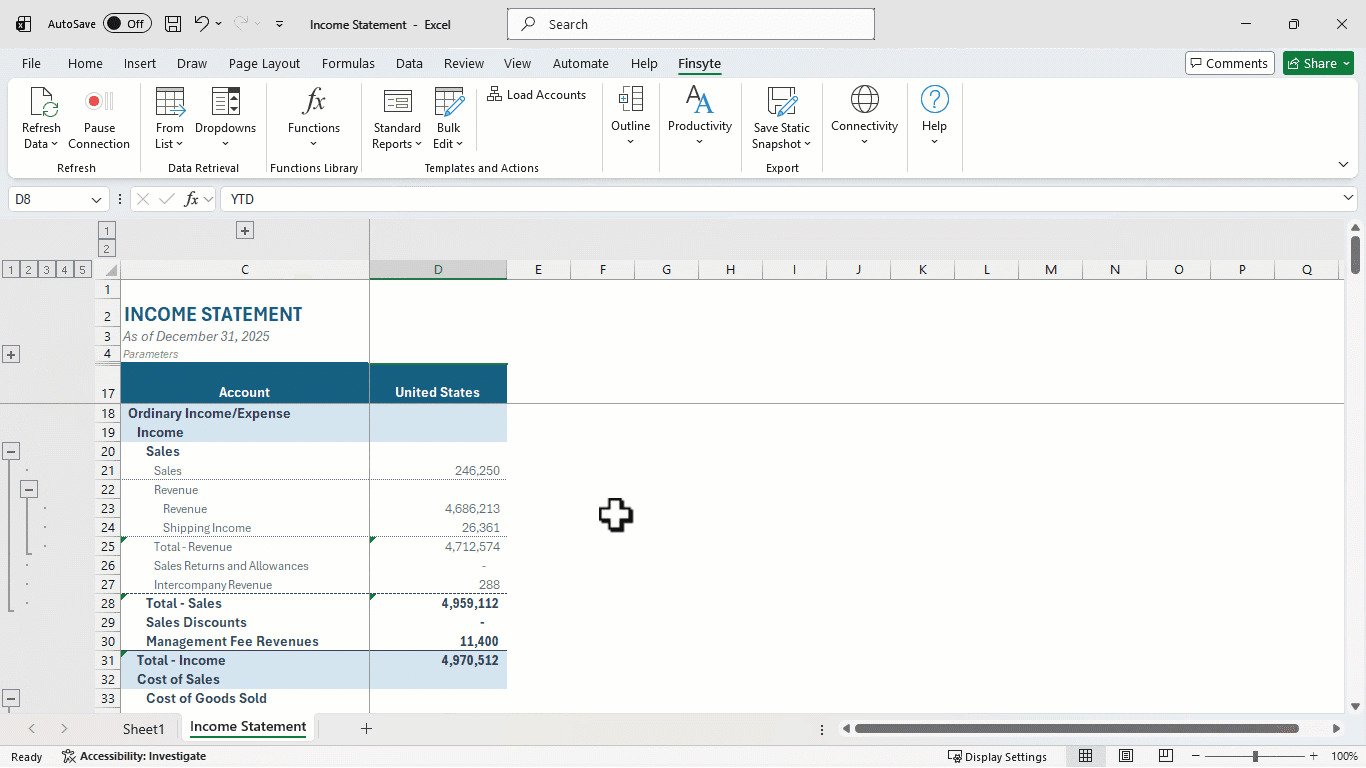
An income statement template that stays connected to NetSuite
Every amount is a live formula reading your NetSuite general ledger, not a pasted value, so a refresh brings the whole P&L up to date. Load Accounts builds it from your own chart of accounts.
- A live balance in every cell, from the purpose-built GLAccountBalance function
- Your chart of accounts in a collapsible tree, from Ordinary Income/Expense down to each account
- Revenue shown as positive, with Gross Profit, Net Ordinary Income and Net Income calculated for you
- A Net Income (Check) row, pulled straight from NetSuite to confirm no account is missing
- Drill down from any amount to the transactions behind it
A static snapshot of a finished income statement, so you can see the layout before you connect NetSuite.
From a blank sheet to a NetSuite P&L in four steps
Insert the template
On the Finsyte ribbon, choose Standard Reports › Income Statement › Income Statement. A new Income Statement sheet opens with its parameters at the top.
Set the parameters
Pick the Subsidiary, Fiscal Year, Period Number and Period Range. Department, Class, Location and the other filters are optional.
Load Accounts
Finsyte returns every income statement account for that subsidiary, in NetSuite’s hierarchy, with subtotals and net income.
Refresh when the books change
Use Refresh Data after new postings. The amounts update in place, and so do your own calculations.
A NetSuite income statement by month, by department or by class
The parameters sit above the balance column, and every amount in that column reads from them. Each cell is its own formula, so a column you copy works on its own: change a parameter and the formulas in that column recalculate automatically, leaving the others as they are.
By month, quarter or year to date
Period Range sets the span: PTD for a single month, QTD for the quarter to date and YTD for the year to date. For a P&L by month, set Period Range to PTD, then duplicate the balance column and change only the Period Number in each copy. Twelve columns give you the year, each one live, and Gross Profit, Net Ordinary Income and Net Income calculate in every column, so each month shows its own margins.
Any segment, any combination
Department, Location, Class and your custom segments, such as Activity Code, are parameters on every column. Set one for a P&L by department, or combine several in one column. Choose which appear in Template Parameters. Copy the column once per department to see them side by side, and add your own total columns to group several together.
By subsidiary, or consolidated
Set Subsidiary to one entity, or pick its (Consolidated) entry to roll up that subsidiary and every subsidiary below it. Start from the top-level (Consolidated) subsidiary and Load Accounts brings in every account you have. Accounts an entity doesn’t use show 0. A subsidiary’s column shows its own currency by default, or the top-level parent’s currency when you set the column’s Currency, translated at NetSuite’s own exchange rates. Each cell carries its own currency, so entity P&Ls in local and parent currency can sit on the same sheet.
Read it at any level
Every level of the account tree is an Excel outline group. Collapse to Total - Income, Cost of Sales and Expense for the board, or open Expense to every account for a department review. A collapsed group shows its total in place, so the summary still adds up.
Signs that read naturally
Income and Other Income accounts are sign-reversed, so revenue shows as a positive number and expenses subtract from it. It’s the same reversal that right-click Switch Sign applies to any balance.
Break an amount down
Right-click any amount and choose Drill Down. A new sheet breaks that one number down by department, class, location, subsidiary, period or entity, or lists the transaction lines behind it, all within the same parameters as the cell.
Compare this year to last year
A P&L with two years side by side, plus Variance and % Variance columns, has its own template. See the comparative income statement.
It’s Excel, so make the P&L yours
The template gets you started. In Excel, you make it your own: every amount is a cell formula, so you can add rows and columns around it: gross margin %, EBITDA or a budget column. A refresh updates the amounts, and your calculations follow.
- Gross margin % and operating margin
- EBITDA and other management rows
- Month, quarter and year-to-date columns
- Your own number formats and styles
- Charts that update on refresh
NetSuite income statement in Excel: FAQ
- QHow do I build an income statement by month from NetSuite in Excel?
- Insert the Finsyte Income Statement template, set Period Range to PTD, and choose Load Accounts. Then duplicate the balance column once per month, changing only the Period Number. Every column stays connected to NetSuite.
- QCan I run the income statement by department or by class?
- Yes. Set the Department or Class parameter on a column and every amount in it is filtered to that value. Each cell works independently, so you can give each department its own column or add your own totals that group several together.
- QHow do I compare this year’s P&L to last year’s?
- Use the Comparative Income Statement template. You set the fiscal year for each of its two columns, and Variance and % Variance columns calculate the change between them.
- QCan I add my own calculations, like gross margin percent?
- Yes. Add rows or columns with ordinary Excel formulas that point at the live amounts, such as gross profit divided by total income. They recalculate whenever you refresh.
- QIs there a free income statement template?
- Yes. Download the sample workbook on this page, a static snapshot of a finished income statement, to see the layout. The live version, connected to your NetSuite account, comes with a free Finsyte trial.
Try the income statement template with your own NetSuite data
30-day free trial with every Finsyte template included. No credit card required.