NetSuite Comparative Balance Sheet in Excel
Two NetSuite balance sheets side by side in Excel, each column live, with the change in every account worked out beside them.
Silent screen recording in Excel. On the Finsyte ribbon, Standard Reports › Balance Sheet › Comparative Balance Sheet adds a Comparative Balance Sheet sheet with a parameter block above two balance columns, D and E. Load Accounts stays greyed out until Subsidiary is filled in. Subsidiary is set to United States in column D, and column E follows it. Column D’s Fiscal Year is set to FY 2025; column E’s starts blank and is set to FY 2024. Period Number is set to 12 and Period Range to YTD in column D, and column E follows both. Book stays on Primary Accounting Book. The title line updates to As of December 31, 2025, and the column headings read FY 2025, FY 2024, Variance and % Variance. Load Accounts collapses the parameters and fills the account tree under Assets, Current Assets and Bank: the Cash accounts US Checking, Bank Rec Demo Account and US Checking - Account Reconciliation roll up to Total - Bank of 3,704,768 for FY 2025 against 2,095,378 for FY 2024, a variance of 1,609,390, or 77%. Accounts Receivable follows.
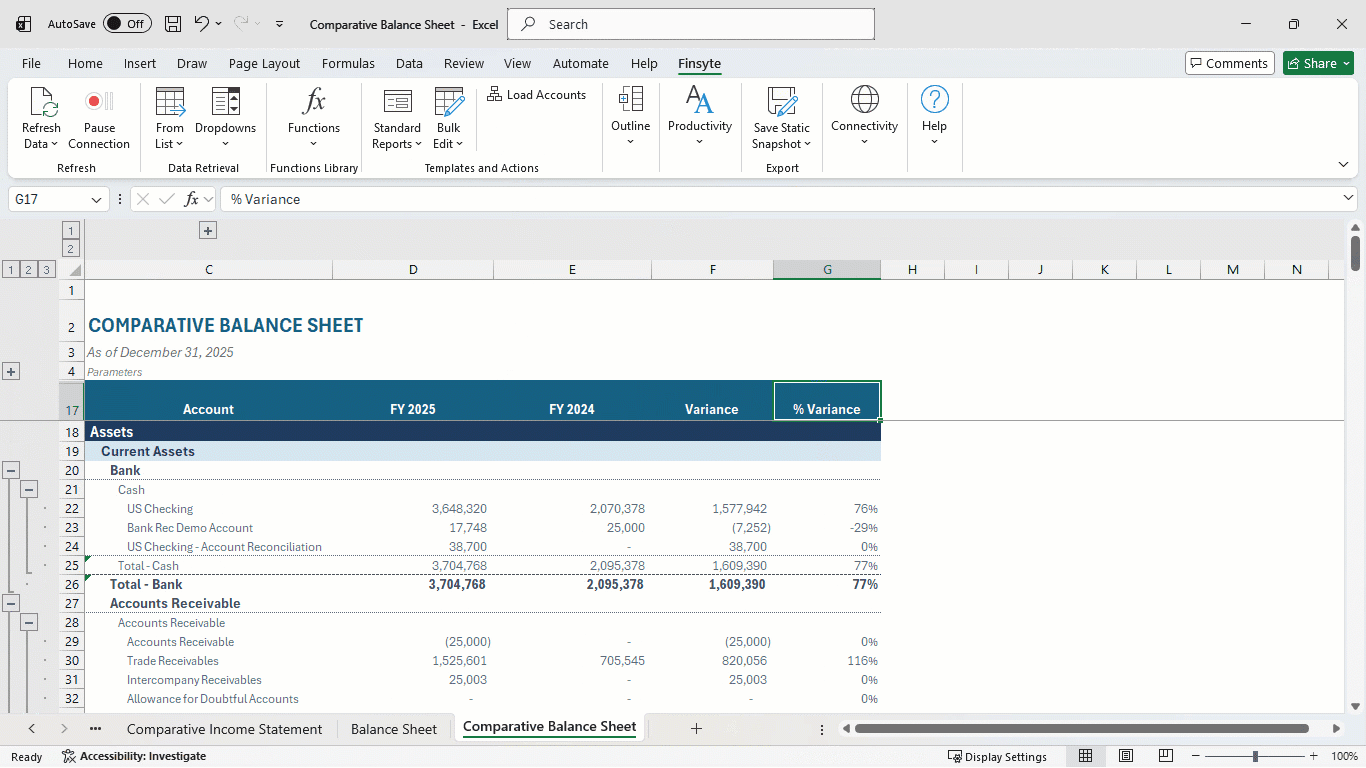
A comparative balance sheet that shows how your position changed
Each column is a complete balance sheet built from your NetSuite chart of accounts. Variance and % Variance sit beside them, so the change in cash, receivables or debt is already calculated.
- Two balance columns, each filled by the purpose-built GLAccountBalance function from its own parameters
- Variance and % Variance on every account and every subtotal
- Your NetSuite account tree in Excel outline groups, from Assets and Liabilities & Equity down to subaccounts
- Liabilities & Equity sign-reversed, with Retained Earnings and Net Income rows added under Equity
- Drill down from either column to the transactions behind a balance
A static snapshot of a finished comparative balance sheet, so you can see the layout before you connect NetSuite.
Two balance sheets side by side in four steps
Insert the template
On the Finsyte ribbon, choose Standard Reports › Balance Sheet › Comparative Balance Sheet. A new sheet opens with a parameter block above two balance columns.
Pick both years
Fill in Subsidiary, Fiscal Year, Period Number and Period Range in column D. Then choose column E’s Fiscal Year, which starts blank. Its other parameters follow column D.
Load Accounts
Load Accounts brings in your balance sheet accounts and fills both columns, with Variance and % Variance beside them.
Refresh at each close
Use Refresh Data after new postings, for the current sheet or the whole workbook. Both years update, and the variances follow.
How the NetSuite comparative balance sheet is built
The comparative balance sheet is a grid of ordinary Excel formulas. Two columns call the same Finsyte function with different parameters, and everything else is arithmetic you can read in the cell. It follows the five rules for financial models that scale: inputs sit apart from calculations, each Finsyte function has a cell to itself, and totals use AGGREGATE.
The parameter block
Subsidiary, Fiscal Year, Period Number, Period Range and Book sit at the top of each balance column. Below them come the optional filters: Item, Class, Department, Location, Entity, Transaction Type, Posted, Currency and your custom segments. You choose which of them appear in Template Parameters. Every balance in a column reads from these cells, so change one and the formulas in that column recalculate automatically.
The account tree
Load Accounts reads your hierarchy from NetSuite: Assets, then Liabilities & Equity, down to each account and subaccount. Every level becomes an Excel outline group, so you can collapse the sheet to its main sections for a board pack or open it to every bank account for the close.
For a consolidated balance sheet, or to compare subsidiaries later, set column D to the top-level (Consolidated) subsidiary before you load, so every account comes in. An account a subsidiary can’t use returns 0.
Two period columns, one function
Each balance is a single call to GLAccountBalance. With every optional filter row turned on, the cell for one account in column D reads:
=FSN.GLAccountBalance(D$5,D$6,D$7,D$8,$B22,D$9,D$10,D$11,D$12,D$13,D$14,D$15,D$16,D$17)The parameter references lock the row and the account reference locks the column, so the same formula in column E reads column E’s parameters for the same account. Row numbers in these examples vary with your chart of accounts and the filter rows you include.
Column E’s Fiscal Year starts blank, and you pick both years. Its other parameters are formulas such as =$D5, so they follow column D until you overwrite them. For year-end against year-end, set Period Number to your last period and Period Range to YTD, which returns each balance as of period end. For this month-end against last, give both columns the same year and type the earlier period into column E.
Variance and % Variance
Variance subtracts column E from column D on the same row:
=D20-E20% Variance divides that change by the size of column E, so it always carries the same sign as Variance. It shows n/m (not meaningful) when column E is 0 but column D isn’t:
=IF(E20=0,IF(D20=0,0,"n/m"),(D20-E20)/ABS(E20))On a balance sheet, these two columns answer the working capital questions: how much receivables grew, how far payables fell, how much cash the year added. An account that is new this year reads n/m rather than a misleading 0%.
To see what’s behind a change, right-click the balance in either column and choose Drill Down. A new sheet breaks it down by period, subsidiary, entity or transaction line, within that cell’s parameters.
Subtotals and signs
Each group total is an AGGREGATE over the rows above it:
=AGGREGATE(9,0,D$20:D$29)AGGREGATE skips nested subtotals inside its range, so a section total never counts the totals beneath it twice. Collapse a group and its header row shows the total in their place.
Accounts under Liabilities & Equity are sign-reversed so the sheet totals like a printed balance sheet. A reversed account is the same call with a leading minus, =-FSN.GLAccountBalance(…), which is what right-click › Switch Sign does. Equity also gets Retained Earnings and Net Income rows, followed by a Cumulative Translation Adjustment block.
Change what’s compared
The parameter rows collapse after Load Accounts. Expand them with the outline button, then overwrite one of column E’s cells:
- Subsidiary, to set two entities side by side as of the same date
- Currency, to show both columns in the top-level parent’s currency when the entities’ currencies differ
- Book, to compare your primary accounting book with a secondary one
- Location or a custom segment, to compare two parts of the business
A segment works when your balance sheet postings carry it, including custom segments such as Activity Code, and you can combine several in one column. The formulas recalculate automatically, and Variance follows. For a single balance sheet by month or by subsidiary, see the NetSuite balance sheet template.
It’s Excel, so build on the comparison
The template gets you started. In Excel, you make it your own: every number is its own cell formula, so you can add ratios, notes and extra periods around them. A refresh updates both years, and your formulas follow.
- Working capital for both years
- Current ratio and debt-to-equity
- A third period column
- Commentary on large variances
- Highlights on accounts that moved
NetSuite comparative balance sheet: FAQ
- QHow do I compare two years of balance sheets from NetSuite in Excel?
- Insert the Comparative Balance Sheet template, fill in column D, and choose a Fiscal Year for each column. Set Period Range to YTD so each column shows balances as of period end, then choose Load Accounts. Both years fill in, with Variance and % Variance beside them.
- QCan I compare subsidiaries instead of years?
- Yes. Set column D to the top-level (Consolidated) subsidiary before Load Accounts so every account comes in. Then give both columns the same Fiscal Year and change the Subsidiary in each. Each column shows its subsidiary’s own currency by default; when the two differ, set both columns’ Currency to the top-level parent’s currency. Accounts a subsidiary can’t use return 0 and can be ignored.
- QHow are Variance and % Variance calculated?
- Variance is column D minus column E. % Variance is that difference divided by the size of column E, so it carries the same sign as Variance, and it shows n/m when column E is 0. Both are plain Excel formulas you can read in the cell.
- QCan I add a third period?
- Yes. Each cell is its own formula, so copy a balance column, paste it beside the others, and set its Fiscal Year or Period Number. Add a variance column for it if you want one.
- QWill my own formulas survive a refresh?
- Yes. A refresh recalculates the Finsyte functions, and any formula that points at them follows. Once you’ve customized the layout, don’t run Load Accounts again: it rebuilds the template’s own columns and undoes your changes.
Try the comparative balance sheet template with your own NetSuite data
30-day free trial with every Finsyte template included. No credit card required.
Related templates
- NetSuite Balance Sheet in Excel
- NetSuite Income Statement Template for Excel
- NetSuite Cash Flow Statement in Excel
- NetSuite Trial Balance in Excel
- NetSuite Budget vs Actual in Excel
- Five rules for financial models that scale
- All NetSuite Excel report templates
- Comparative Balance Sheet Template: setup steps in the docs