NetSuite Comparative Trial Balance in Excel
Every NetSuite account balance for two periods side by side in Excel, with the movement in each account calculated for you.
Silent screen recording in Excel. On the Finsyte ribbon, Standard Reports › Trial Balance opens a submenu with Trial Balance, Grouped Trial Balance, Comparative Trial Balance and Comparative Grouped Trial Balance. Comparative Grouped Trial Balance adds a Comparative Trial Balance sheet with a parameter block above two columns, D and E. Subsidiary is set to Headquarters (Consolidated) from the list of subsidiaries, and column E follows it. Column D’s Fiscal Year is set to FY 2025 and column E’s to FY 2024. Period Number is set to 12, and Period Range to YTD from a list of ITD, YTD, RTD, QTD, PTD and TTD; column E follows both. The title line updates to As of December 31, 2025. Load Accounts collapses the parameters and fills the accounts, grouped by the chart of accounts. Under Cash, accounts including US Checking, Canada Checking, UK Checking and Bank Rec Demo Account roll up to Total - Cash of 3,782,975 for FY 2025 against 2,208,488 for FY 2024, a variance of 1,574,486, or 71%. Accounts Receivable follows.
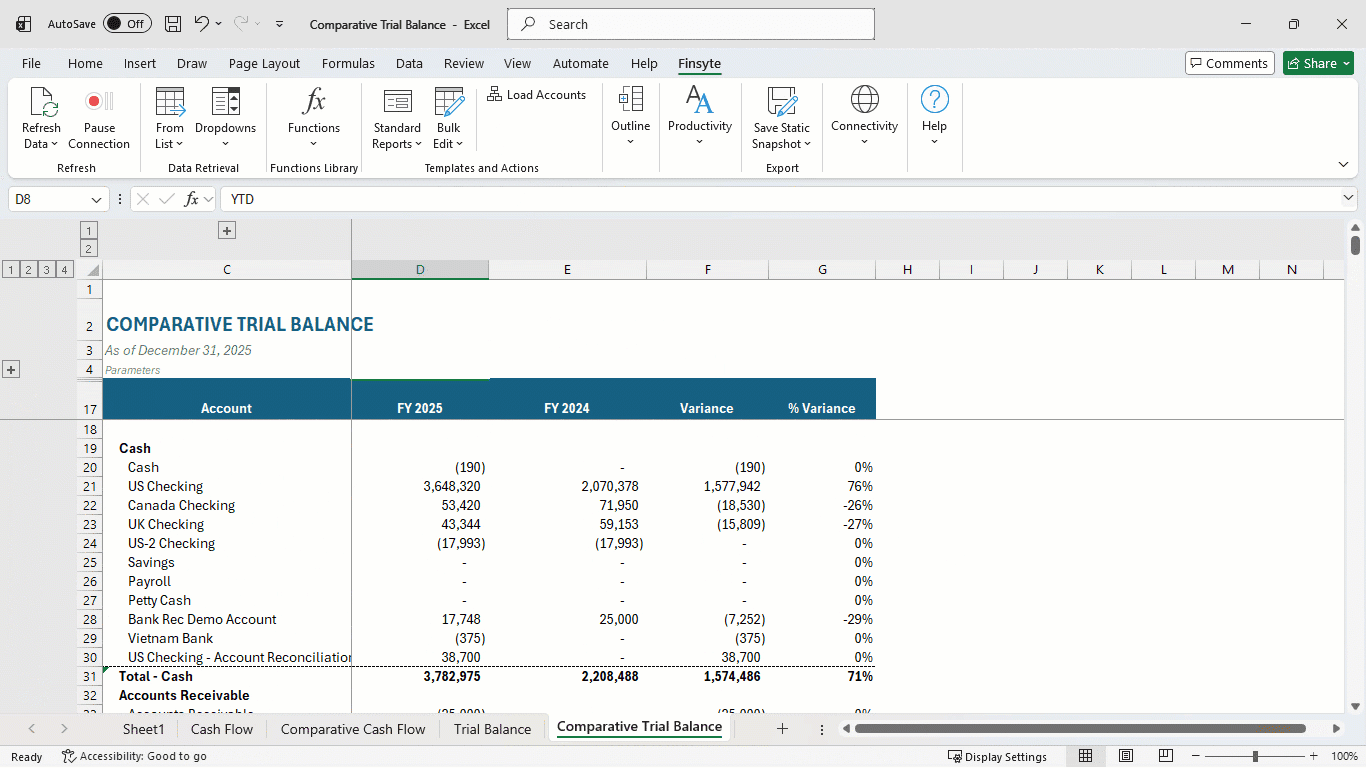
Every account, two periods, and the movement between them
The template lists every active account from NetSuite, balance sheet and income statement alike, with a balance for each period. Variance shows which accounts moved, so you know where to look first.
- Every active account in your chart of accounts, from the balance sheet and the income statement
- A grouped version organized by your chart of accounts, or a flat list
- Balances without sign reversal, apart from the Cumulative Translation Adjustment block
- Variance and % Variance on every account, with a Total row at the bottom
- Drill down from any balance to the transactions behind it
A static snapshot of a finished comparative trial balance, so you can see the layout before you connect NetSuite.
A two-period trial balance in four steps
Pick a layout
On the Finsyte ribbon, choose Standard Reports › Trial Balance, then Comparative Grouped Trial Balance for the chart-of-accounts layout or Comparative Trial Balance for a flat list.
Set both periods
Complete column D’s required parameters, then choose a year for column E. Everything else in column E mirrors column D.
Load Accounts
Load Accounts returns every active account and fills in both periods, with the two variance columns beside them.
Review the movement
Scan Variance for accounts that moved more than expected, then right-click one and choose Drill Down to see why.
How the NetSuite comparative trial balance is built
A comparative trial balance sets every account in your ledger against two periods. Each balance is its own Finsyte function call, and the comparison is plain Excel. The design comes from the five rules for financial models that scale: the inputs sit in one block, every Finsyte function has a cell of its own, and totals use AGGREGATE.
The parameter block
Book and the four required parameters, Subsidiary, Fiscal Year, Period Number and Period Range, sit above each period column. Department, Class, Location and Item filters, along with Entity, Transaction Type, Posted, Currency and custom segments, follow as optional rows. Those rows come from your choices in Template Parameters. Each balance reads from the cells above it, so change one and that column’s formulas recalculate automatically.
For month-end review, set Period Range to YTD. Balance sheet accounts then show their balance as of period end, and income statement accounts show activity for the year to date.
The account tree
Load Accounts brings in every active account in your chart of accounts, covering both the balance sheet and the income statement. Statistical accounts and the Cash at Beginning of Period and Net Income system accounts are left out.
Comparative Grouped Trial Balance organizes those accounts by your NetSuite chart of accounts, with Excel outline levels you can collapse. Comparative Trial Balance lists the same accounts flat. Pick the top-level (Consolidated) subsidiary in column D before you load, and the list covers every account in every entity. An entity’s column shows 0 for any account it can’t use, and those rows can be ignored.
Two period columns, one function
Every balance is one call to GLAccountBalance. Here is one account’s balance in column D, with every optional filter row included:
=FSN.GLAccountBalance(D$5,D$6,D$7,D$8,$B22,D$9,D$10,D$11,D$12,D$13,D$14,D$15,D$16,D$17)Because the parameters are row-locked and the account is column-locked, column E holds the same pattern and reads its own parameter cells. Expect different row numbers on your sheet: they follow your chart of accounts and the filters you include.
Column E’s year is the one input you fill yourself, since it starts empty. Its other parameters follow column D through formulas such as =$D7. For month-end against the prior month-end, enter the same year in both columns and overwrite column E’s Period Number with the earlier period.
Variance and % Variance
Variance is column D minus column E for each account:
=D20-E20% Variance is the change over the size of column E’s balance, so credit balances keep the same sign as Variance. An account that is new in column D shows n/m:
=IF(E20=0,IF(D20=0,0,"n/m"),(D20-E20)/ABS(E20))Together they show where the ledger changed between your two periods. Right-click any balance › Drill Down, and a new sheet splits it by subsidiary, period, entity or transaction lines, using the cell’s own parameters.
Totals and signs
Group totals in the grouped version sum the accounts above them with AGGREGATE:
=AGGREGATE(9,0,D$20:D$29)AGGREGATE ignores nested subtotals, so no group is counted twice. A final Total row sums every account in the column.
Account signs aren’t reversed on a trial balance. The one exception is the Cumulative Translation Adjustment block, whose cells carry a minus in front of the call, =-FSN.GLAccountBalance(…), exactly what right-click › Switch Sign would add.
Change what’s compared
Once the accounts load, the parameter rows sit collapsed. Click the + in the outline bar to show them, then type over a column E cell:
- Period Number, for this month-end against last month-end
- Subsidiary, to set two entities’ ledgers side by side
- Currency, to show both columns in the top-level parent’s currency when the entities’ currencies differ
- Book, to put a secondary accounting book next to the primary one
- Location or a custom segment, to review one slice at a time
A segment works when your balance sheet postings carry it, including custom segments such as Activity Code, and you can combine several in one column. Each column’s formulas recalculate automatically, and the variances follow. For a single-period trial balance, see the NetSuite trial balance template.
It’s Excel, so build your review around it
The template gets you started. In Excel, you make it your own: every balance is a cell formula, so tick marks, reconciliation notes and threshold flags can sit right beside the two periods. A refresh updates the balances, and your review columns stay where you put them.
- Reviewer sign-off columns
- Flags for variances over a threshold
- Links to reconciliation workpapers
- Mapping to your reporting lines
- A third period column
NetSuite comparative trial balance: FAQ
- QHow do I compare two years of trial balances from NetSuite in Excel?
- Insert either comparative trial balance template, grouped or flat, and complete column D with YTD as the Period Range for period-end balances. Choose a fiscal year for each column and select Load Accounts. Every account comes back for both periods, with the movement calculated.
- QCan I compare subsidiaries instead of years?
- Yes. Start column D on the top-level (Consolidated) subsidiary when you run Load Accounts, so every account is listed. Use one year for both columns, then point column E at the second subsidiary. Each column shows its subsidiary’s own currency by default; when the two differ, set both columns’ Currency to the top-level parent’s currency. Rows that subsidiary can’t use show 0.
- QHow are Variance and % Variance calculated?
- For each account, Variance subtracts the column E balance from the column D balance. % Variance divides that movement by the size of the column E balance, so it carries the same sign as Variance. When column E is 0 it shows n/m.
- QCan I add a third period?
- Yes. Copy a period column into an empty column and change its year or period. Because each balance is a separate formula, the rest of the sheet is untouched.
- QWill my own formulas survive a refresh?
- Yes. A refresh recalculates the Finsyte functions, and your review columns and other formulas recalculate with them. After you’ve customized the sheet, skip Load Accounts: it starts the template’s columns over and undoes your customizing.
Try the comparative trial balance template with your own NetSuite data
30-day free trial with every Finsyte template included. No credit card required.
Related templates
- NetSuite Trial Balance in Excel
- NetSuite Balance Sheet in Excel
- NetSuite Income Statement Template for Excel
- NetSuite Cash Flow Statement in Excel
- NetSuite Budget vs Actual in Excel
- Five rules for financial models that scale
- All NetSuite Excel report templates
- Comparative Trial Balance Template: setup steps in the docs