Most finance teams who try AI for dashboard-building end up with the same disappointing result: a generic table, a couple of default charts, and formatting that looks like nobody touched it. The AI technically did what was asked. It just wasn't asked well enough.
The gap usually isn't the AI's capability — it's the prompt. Vague instructions produce vague output. But with the right prompting approach and the Finsyte Claude Skill installed, Claude (opens in new tab) can build genuinely presentation-ready dashboards directly in Excel, wired to live NetSuite data through Finsyte functions.
Why "Just Ask the AI" Usually Falls Short
Ask Claude for "a financial dashboard" and it has to guess: which statements to pull from, what layout you want, whether the numbers should be static or refreshable, and what "professional" even means to you. Every unanswered question becomes a default assumption — usually a plain one.
There's also a trust problem. Connect an AI to your NetSuite data through a generic integration and ask a question, and you often get a number back with no way to verify it. For finance, an unverifiable number isn't useful, no matter how good it looks.
The Finsyte Skill Changes What Claude Can Build With
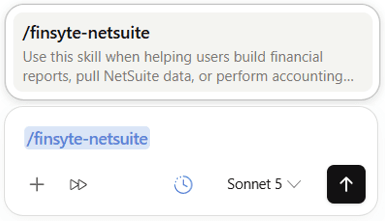
The Finsyte Claude Skill provides usable instructions to Claude. Once it's added to Claude, every dashboard Claude builds uses live Finsyte functions instead of pasted-in values. That means:
- Every figure is traceable — drill down to the NetSuite transactions behind any number, without leaving Excel
- Every report is refreshable — change a parameter cell and the entire dashboard recalculates from current NetSuite data
- Every workbook is verifiable — labeled parameter blocks and consistent formula conventions a controller can actually review
That solves what Claude builds with. It doesn't solve how well Claude builds it — that's still entirely down to the prompt.
What Separates a Weak Prompt from a Strong One
The strongest prompts we've seen share a few habits worth adopting:
- Assign a role. "Act as an expert financial modeler" produces different judgment calls than "build a dashboard." Role framing shapes what Claude prioritizes and how it explains its choices.
- Name the exact deliverable. Specify the sheet name, the sections it should contain, and the chart types you want rather than leaving structure open-ended.
- Set guardrails explicitly. If Claude is working in a workbook that already has other reports, tell it which sheets not to touch. Without that instruction, Claude may reasonably assume it should also update or "improve" nearby sheets — not because it's overreaching, but because you never told it not to.
- Describe the aesthetic in specific terms. "Modern and professional" is vague enough to mean almost anything. "Dark navy header, teal accents, clean sans-serif fonts, generous white space" gives Claude something concrete to execute against.
- Require dynamism. Explicitly ask that the output update automatically when source statements change. Otherwise, you risk getting a polished snapshot instead of a live model — and a snapshot stops being trustworthy the moment the numbers move.
Seeing It in Practice
Here's a real prompt built around those principles, used to generate an Executive Dashboard sheet from an existing Balance Sheet, Income Statement, and Cash Flow:
You are an expert financial modeler.
Using my Finsyte skill and the existing Balance Sheet, Income Statement, and Cash Flow sheets in this workbook, create a complete, investor-ready Executive Dashboard.
Do not modify the existing statements or any other report already in this workbook — only add the new sheet described below.
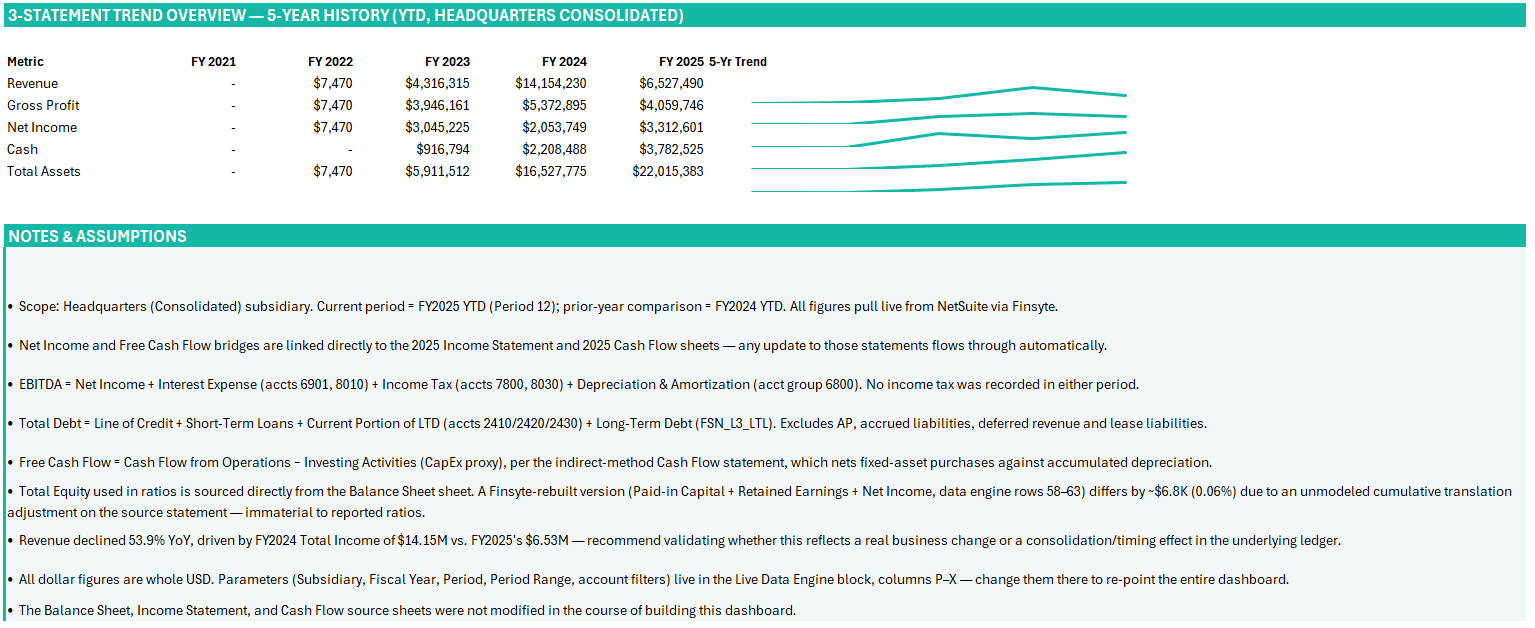
Include key financial highlights with YoY growth, waterfall charts for Net Income and Free Cash Flow, a balance sheet summary with liquidity and leverage ratios, and a 3-statement overview with sparklines.
Use a modern color palette — dark navy, teal accents, clean sans-serif fonts — and make everything dynamic so the dashboard updates automatically when the core statements change.
Notice what's doing the work here: a defined role, a named sheet with a specific list of components, an explicit instruction not to touch other sheets, a described color palette instead of a vague adjective, and a direct requirement for live updating. Every one of the principles above shows up in the prompt itself — none of it is left to chance.
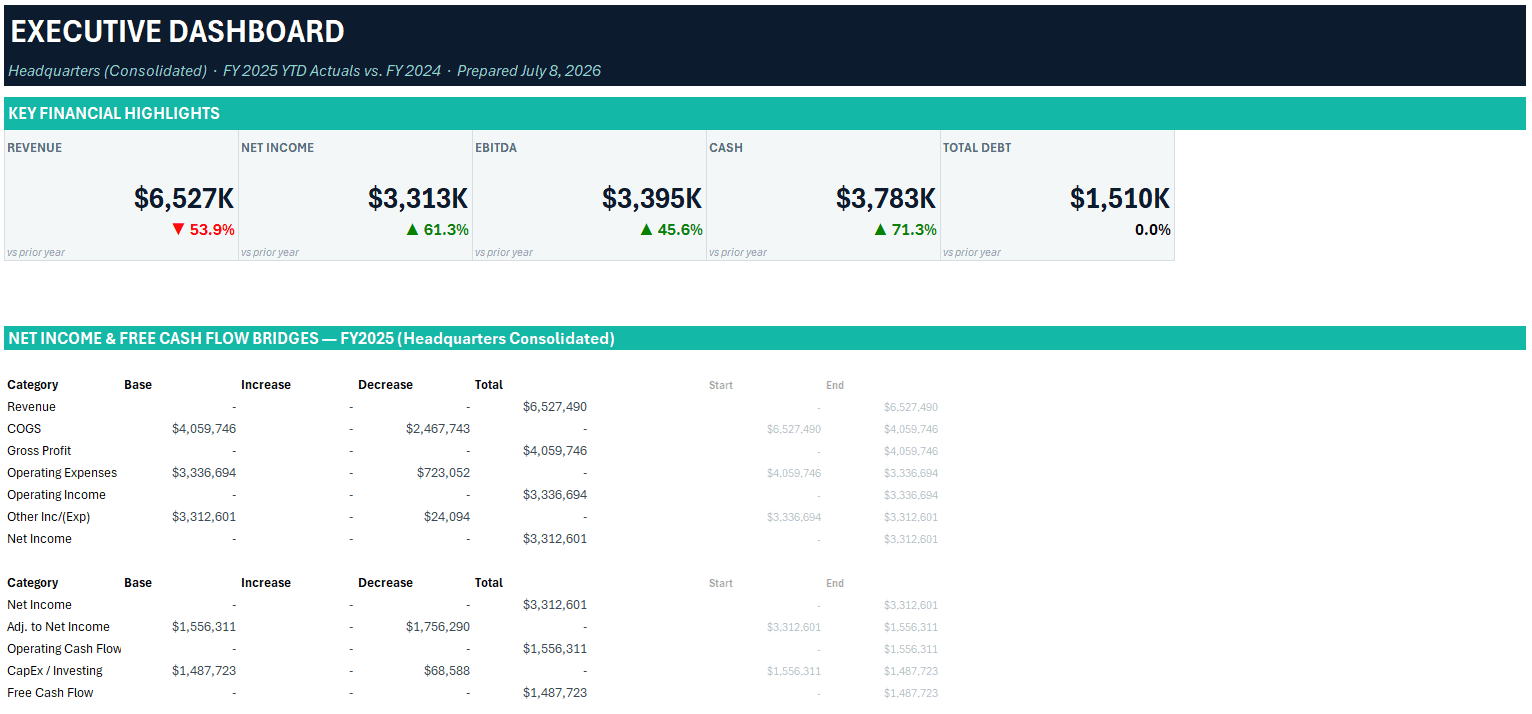
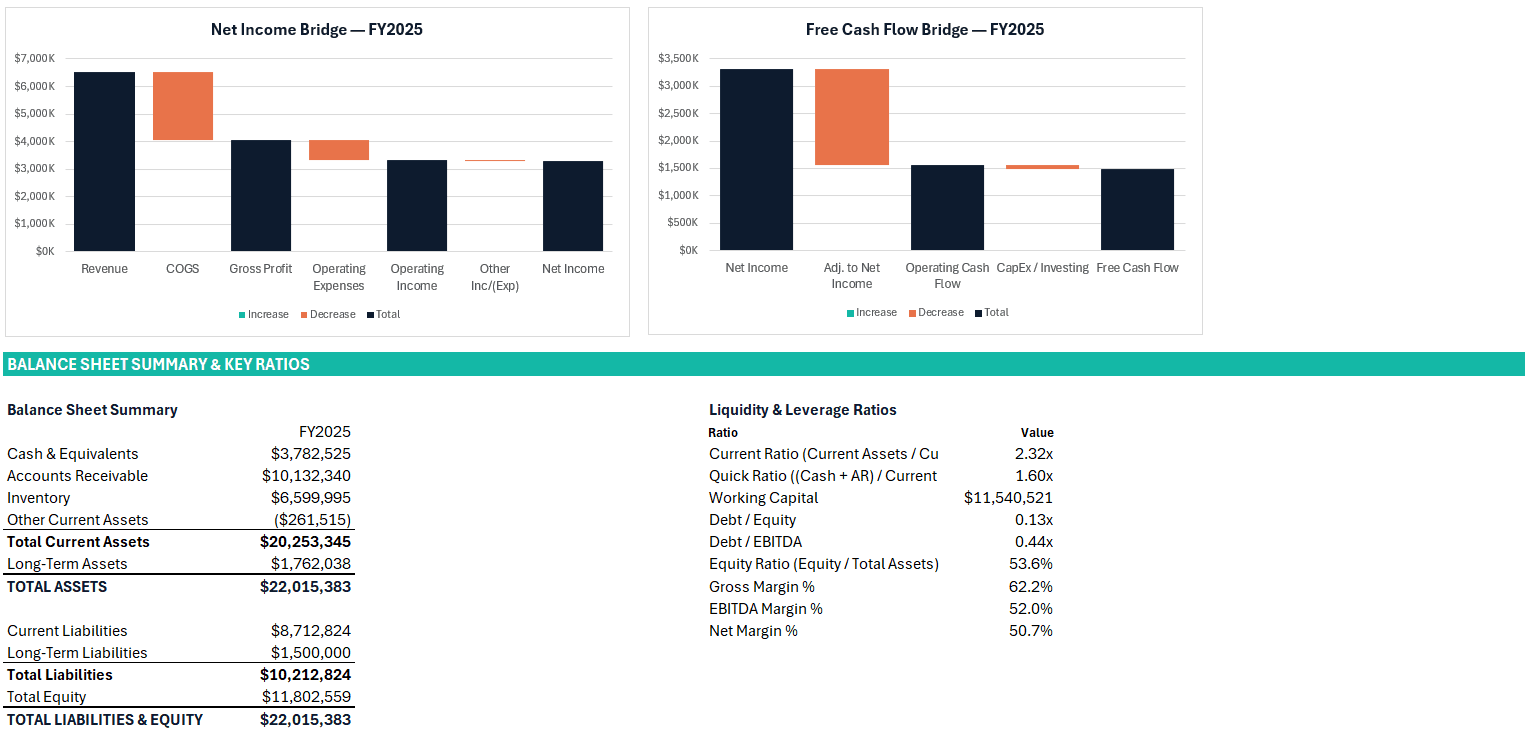
The result is a dashboard with real financial highlights, waterfall bridges, ratio tables, and trend sparklines — built entirely from Finsyte functions, so every figure still traces back to NetSuite and updates the moment the source statements refresh.
The Bottom Line
If prompted correctly, AI can produce dashboard-quality output finance teams are proud to send up the chain. Getting there consistently just takes a specific enough prompt and a skill built for the job — one that keeps numbers traceable back to NetSuite instead of leaving you with a black box you can't defend in a meeting.
Install Finsyte, download the Finsyte Claude Skill, and start building. Don't have Finsyte yet? Watch a demo today to see how it connects Excel to your live NetSuite data.
Claude is a product and registered trademark of Anthropic, PBC; Finsyte is not affiliated with, endorsed by, or sponsored by Anthropic. NetSuite is a trademark of Oracle Corporation. Microsoft Excel is a trademark of Microsoft Corporation.
AI-generated output can contain errors. All reports, including those generated by AI, should be independently validated for accuracy, completeness, and appropriateness before being relied upon for decision-making, financial reporting, audits, regulatory filings, or any other business purpose.